flux percentage graphs
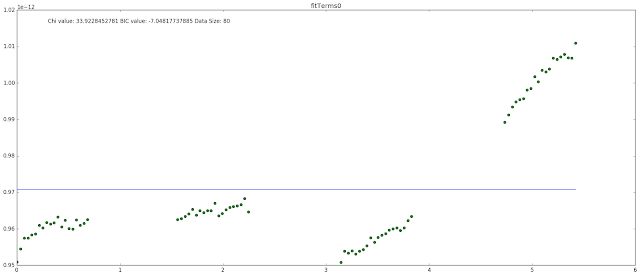
Today I've been working on several different items. First I have figured out why the flux percentage was failing. I was summing the edges of the data and that for whatever reason was causing the whole flux to drop significantly. By only summing the flux from 10600 to 17000 I found that it greatly stabilized the result and I got exactly what I was expected to get. I added to the upper left when less than a percent changes. It is pictured below.


Comments
Post a Comment