waterband depth and graphing variables seperatly
Today I worked on producing a waterband depth graph, which turned out to be more complex than I first thought, especially when propagating the error through to the end. I have left an example of one of the waterband depth plots at the bottom of this post.
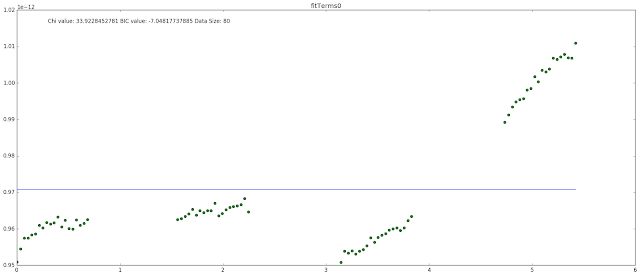
I've also been working on graphing the variables separately for the curve_fit function, which I did successfully. Interestingly enough, each sin cosine pair came out smooth. However, when fit for the function as a whole, the graph comes out bumpy. I also asked the internet about any ideas of what it could be, and I got the answer that it was an expected behavior of the curve_fit function. I've also included pictures below.


I've also been working on graphing the variables separately for the curve_fit function, which I did successfully. Interestingly enough, each sin cosine pair came out smooth. However, when fit for the function as a whole, the graph comes out bumpy. I also asked the internet about any ideas of what it could be, and I got the answer that it was an expected behavior of the curve_fit function. I've also included pictures below.


Comments
Post a Comment