These are several different fits, each one gaining another pair of variables in the fourier transformation. The fit is about the same from 4 parameters on and actually gets worse when getting to large numbers of parameters. I've also included the chi value and the BIC value on every single graph. The BIC value as of right now increases fairly linearly as I add more parameters.
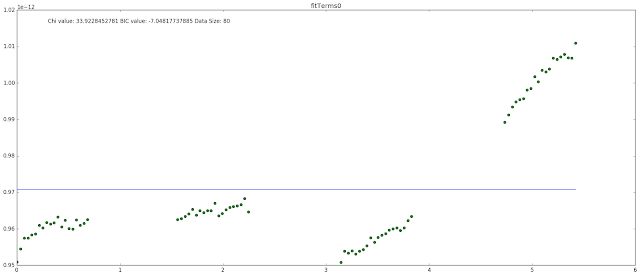


Here are some additional graphs I've been working on that have been fit with a fourier fit of 4 different terms
2MASS-J16291840+0335371
SDSS-J075840.33+324723.4


Here are some additional graphs I've been working on that have been fit with a fourier fit of 4 different terms
2MASS-J16291840+0335371
SDSS-J075840.33+324723.4


Comments
Post a Comment